Metrics aren't one-size-fits-all. It shouldn't take a rocket scientist to know that a software company and an underwear retailer don't exactly have overlapping business models and shouldn't be tracking all the same metrics.
Whether you're a data junkie or a newbie, understanding and tracking the right metrics for your SaaS company is crucial for making informed decisions and driving sustainable growth. Here are 17 important SaaS metrics to track (or just jump to the cheat sheet).
Table of contents:
What are SaaS metrics?
SaaS metrics are the key performance indicators (KPIs) that help you track your SaaS (software as a service) business's health, growth, and success. From customer acquisition cost (CAC) to customer lifetime value (LTV), these metrics can help you win over investors and give you a look into what's going on in marketing, sales, product development, and customer success.
If you're in a hurry, you can reference all of the metrics calculations in this post using the cheat sheet below.
SaaS metrics cheat sheet
Metric | Formula |
|---|---|
New user churn rate | (Users churned within 30 days of activation / All new activated users from the last 30 days) x 100 |
Natural rate of growth (NRG) | 100 x Annual growth rate x Organic signups (%) x ARR from products (%) |
Burn multiple | Cash burned / New ARR (Annual Recurring Revenue) |
Activation velocity | % of leads activated 48 hours after account creation |
Expansion revenue | ARR from cross-sells + ARR from upsells |
Revenue churn | (Lost revenue from existing customers in a given period / Total revenue from existing customers in the same period) x 100 |
Customer acquisition cost | Total marketing and sales expenses / Number of new customers acquired |
Customer lifetime value | Customer value x Average customer lifespan |
Net Promoter Score | % promoters - % detractors |
Months to recover CAC | CAC / (Monthly recurring revenue x Gross margin) |
LTV-to-CAC ratio | Total revenue generated over their lifetime (LTV) / Cost of acquiring a customer (CAC) |
Leads by lifecycle stage | Total number of leads x % of leads in each lifecycle stage |
Average first response time | Total time to first response / Total number of inquiries |
Average resolution time | Total time taken to resolve all issues / Number of issues resolved |
1. New user churn rate
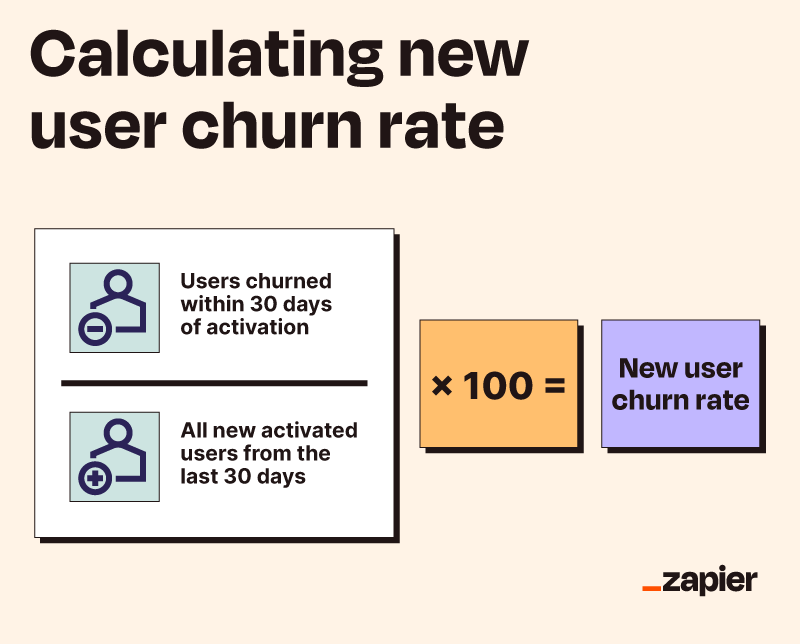
Customer churn is a valuable metric on its own, but Matt Hammel from AirOps says you should also include new user churn rate in a PLG (product-led growth) metrics framework. This data point helps you see the percentage of users who churn within 30 days of activating.
Use this calculation to measure new user churn rate:
New User Churn Rate = (Users churned within 30 days of activation / All new activated users from the last 30 days) x 100
Not surprisingly, high levels of new user churn within the first month of activation are often a function of poor onboarding. However, churn is also normal and unavoidable. If your new user churn rate is higher than you'd like, the best thing to do is discover the root cause. A poor onboarding experience, lackluster customer support, and product complexity can all lead to increased new user churn.
2. Natural rate of growth (NRG)
Natural rate of growth (NRG) measures how quickly a company would grow without any effort—in the form of marketing and sales—or outside investments. Essentially, NRG allows SaaS companies to determine what percentage of their recurring revenue comes from organic channels and begins with the product. Here's the calculation:
Natural Rate of Growth = 100 x Annual Growth Rate x Organic Signups (%) x ARR from Products (%)
Let's say your company has an annual growth rate of 1.2 or 120%, 90% annual recurring revenue from products, and an organic signup rate of 65%. Using the above formula would put your NRG at approximately 70%.
With growth tracking, bigger percentages are always better, but 70% is still a good rate for a company with an ARR of $1 million to $10 million. And for companies with higher ARRs—either $10 million to $50 million or more than $50 million—it's even better.
NRG is a valuable metric for product-led SaaS companies because it measures growth potential and helps organizations set realistic growth goals and track their progress over time.
3. Burn multiple
Burn multiple measures the efficiency and sustainability of a company's growth model—it's your net cash burned divided by your net new ARR in a given period. It's a fantastic complement to growth metrics like NRG because it contextualizes growth as a function of investment.
Burn Multiple = Cash Burned / New ARR (Annual Recurring Revenue)
A high burn multiple means the company is burning through capital to grow.
A lower burn multiple indicates more efficient growth.
Because it's a measure of your company's capital efficiency, you generally want to keep it as low as possible. But keep in mind that burn multiple is highly sensitive to a company's size and stage. For example, an early-stage company attempting to find product-market fit will likely have a higher burn multiple in the beginning.
4. Activation velocity
Activation looks different for every SaaS company, so it's important to define what it means to your organization. For example, AirOps counts a user as activated when they set up a sync from their data warehouse to an operating document, like a Google Sheet, Airtable base, or Notion database. At a company like Zapier, activation would be a user turning on their first Zap.
The calculation is pretty straightforward:
Activation Velocity = % of leads activated 48 hours after account creation
Why 48 hours? This timeframe demonstrates how effective and efficient the user onboarding experience is. You can use other milestones, though, depending on your company.
One of the most effective ways to use this metric is to plot activation rates versus time. This will help you see if there are any hurdles to activation and where the onboarding/activation process needs some tweaks (which is another reason to use 48 hours as the time period).
5. Expansion revenue
Expansion revenue refers to additional revenue generated from a customer after their initial purchase. Some PLG SaaS companies like to measure this metric in terms of monthly recurring revenue (MRR), but you can choose any timeframe that makes sense for your organization. For instance, you could measure expansion revenue as it relates to annual recurring revenue (ARR).
The formula is a simple one:
Expansion Revenue = ARR from cross-sells + ARR from upsells
Expansion revenue is generated from cross-sells and upsells, like a customer purchasing additional features or upgrading to a higher-priced plan as their need for your product increases.
This metric measures how effectively your company can generate revenue from customers that already know and love your brand—which is far more cost-effective than acquiring new customers. If you want to increase expansion revenue, it's essential to:
Understand exactly why your customers find your product valuable
Understand your customer journey and how customers react at different stages of that journey
Develop features that complement your core offering
Make the upgrading experience frictionless
6. Revenue churn
Revenue churn, also known as monthly recurring revenue (MRR) churn, describes the loss of revenue from existing customers over a given period of time—typically a month. To make sure your growth chart is moving up and to the right, you need to evaluate how much money you're losing from customers canceling or downgrading their subscriptions, as that directly impacts your revenue stream.
Revenue Churn = (Lost revenue from existing customers in a given period / Total revenue from existing customers in the same period) x 100
As an example, imagine a software company lost $15,000 due to subscription cancellations and downgrades in one month. During that same month, they brought in $120,000 in subscription renewals and upgrades. This would put their revenue churn at 12.5%. Most companies aim for low (0 to 5%) or negative revenue churn rates.
This metric can help do a few things:
Add context to customer churn: Losing customers at all isn't great, but losing customers that drive the most revenue is even worse. If all your churn is from a free plan, it might be less of a problem than if you're churning enterprise customers.
Predict runway: To estimate recurring revenue in the future, you need to account for how much revenue you'll lose to churn.
Reveal pricing issues: Tracking churn to a certain price plan can help you pinpoint the problem and fix it to avoid churn in the future.
Evaluate revenue retention: Ultimately, revenue churn expresses how well your company retains revenue. Growth requires attracting and retaining customers.
7. Monthly unique visitors
Monthly unique visitors (MUV) measures the number of individual visitors to your company's website or platform over a month. This metric allows your company to track the growth of your user base, evaluate how successful your marketing campaigns are, and find ways to improve user acquisition and retention strategies. You can track this metric in Google Analytics (or a comparable analytics platform), as Google assigns unique identifiers to website visitors in order to track returning and unique visitors to your website.
While the number of total visits may be a more impressive number to present to stakeholders, MUV gives the most accurate picture of how many people are visiting your website. Of course, returning visitors are important too, as they demonstrate a loyal customer base. But if you want to boost software subscriptions, you should boost your number of monthly unique visitors, too.
8. Customer acquisition cost
Customer acquisition cost (CAC) refers to the total amount of money a company spends to acquire a new customer. Whether you're driving customers down the funnel via product demos or free trials, any marketing, advertising, and sales expenses incurred in attracting and converting a lead into a paying customer is your CAC.
Customer Acquisition Cost = Total marketing and sales expenses / Number of new customers acquired
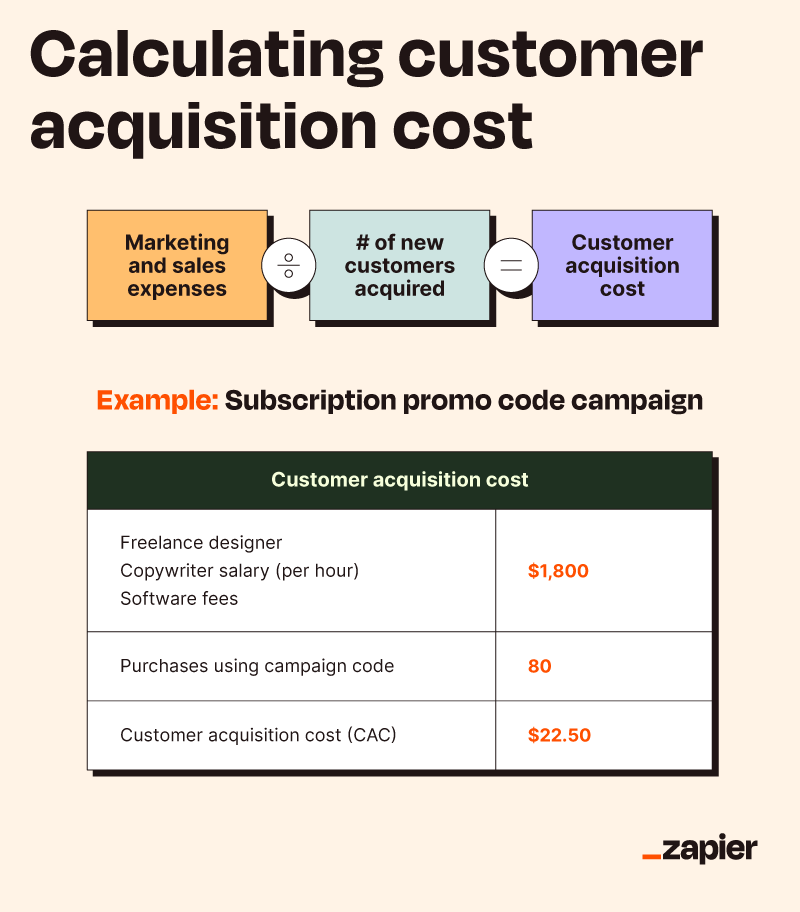
Calculating CAC can help you determine if the investment you're making on marketing tactics like high-quality blog content or digital advertising is actually helping you gain customers. If you're spending hundreds of thousands wooing prospective customers just to get ghosted, it may be time to reevaluate your strategy.
9. Customer lifetime value
Customer lifetime value (LTV or CLV) measures the revenue you think you'll get from a customer while they're with your business. To get this number, you have to take into account your customers' subscription or purchase histories and their projected future spending. This metric is a key indicator of the long-term profitability of a SaaS company.
Customer Lifetime Value = Customer value x Average customer lifespan
When you break that down further to include calculations for customer value and average customer lifespan, that formula is:
Customer Lifetime Value = (Average purchase value x Average purchase frequency rate) x (1 / Churn rate)
Keep in mind, since some companies may not have a lot of historical lifespan data on their customers, you can use 1 / Churn rate to find your average customer lifespan.
For example, imagine your average customer subscribes to one of your software services for $50 per month. Let's also say your churn rate is 6%. Your customer lifetime value would be $10,000.
(50 x 12) x (1 / 0.06) = $10,000
10. Net Promoter Score
Net Promoter Score (NPS) is a metric used to measure customer satisfaction and loyalty. The score is based on survey answers to one question: "How likely are you to recommend our software to a friend or colleague?"
Customers rate their response on a scale of 0-10, with 0 being not likely at all and 10 being extremely likely. Respondents whose ratings fall between 0 and 6 are considered "detractors," and those that fall between 9 and 10 are considered "promoters," with everyone in between landing in the "passives" category. The formula for calculating NPS with these responses is:
Net Promoter Score = % promoters - % detractors
Here's an example of an NPS survey from Airtable.
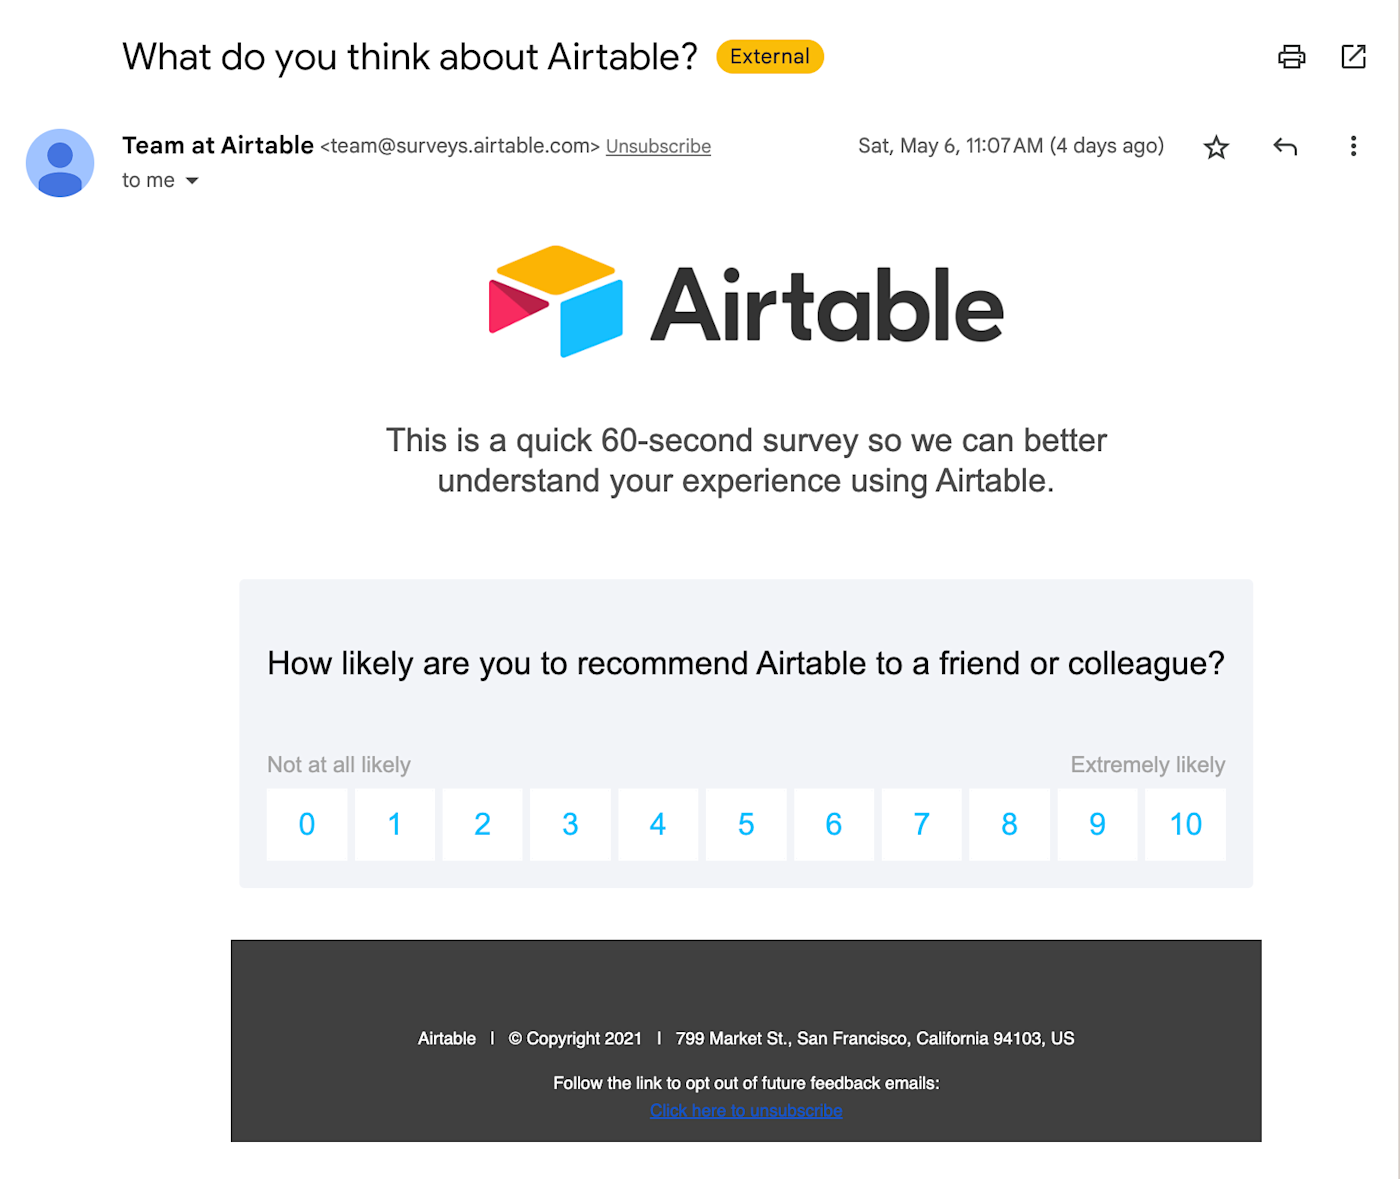
Scores can range from -100 to 100—with scores higher than 0 being good and scores above 50 being excellent. Unhappy customers probably won't recommend you to their friends, so this is an opportunity to turn that frown upside down, so you can grow your business.
11. Months to recover CAC
Months to recover CAC measures the amount of time it takes for a SaaS company to recover the cost of acquiring a new customer through their subscription revenue. The goal of this metric is to evaluate the profitability of a company's customer acquisition strategy.
Months to Recover CAC = CAC / (Monthly Recurring Revenue x Gross Margin)
A shorter recovery period indicates a more efficient and profitable customer acquisition strategy, while a longer recovery period may suggest that adjustments need to be made. Customer acquisition can be a long game, but it's much more profitable if it's not.
Tracking months to recover CAC allows SaaS companies to assess the financial health of their business model and optimize their pricing and sales strategies to increase profitability.
12. LTV-to-CAC ratio
LTV-to-CAC ratio compares the cost of acquiring a customer (CAC) to the total revenue generated over their lifetime (LTV). It's a metric used to assess the efficiency and sustainability of your customer acquisition and retention strategies.
LTV-to-CAC Ratio = LTV / CAC
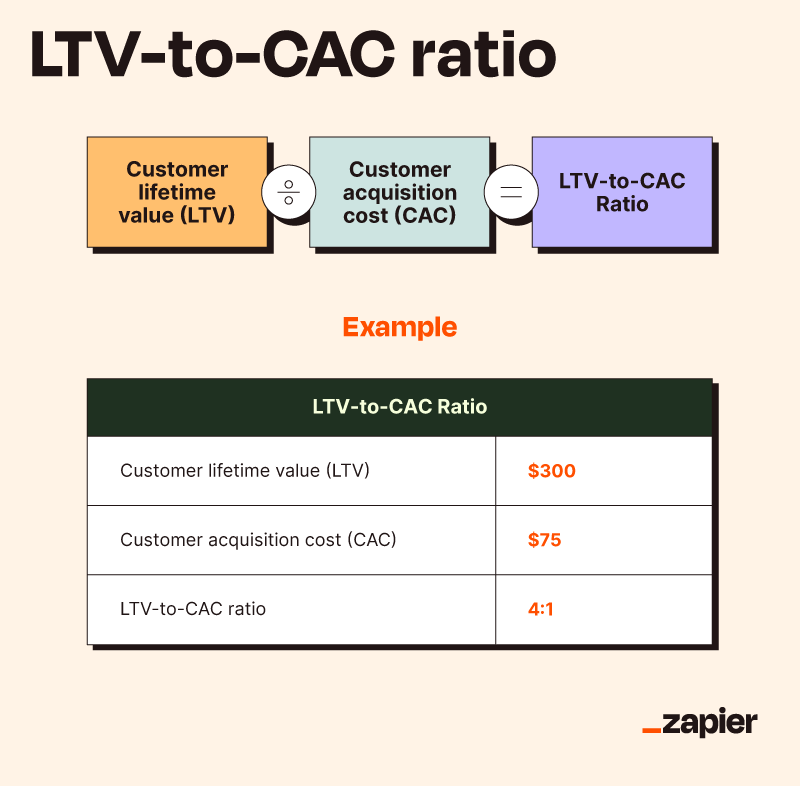
If you've calculated your average customer LTV to be $300 and your business's CAC during a certain period to be $75, your LTV-to-CAC ratio will be 4:1—a very good result.
A ratio of 3:1 is generally the industry benchmark, as it indicates that the company is generating more revenue from each customer than it costs to acquire them, suggesting a sustainable business model. A 1:1 ratio or lower means you're losing money, and it's time to make your marketing and sales efforts more efficient.
13. Leads by lifecycle stage
SaaS companies use leads by lifecycle stage to track the number of potential customers in each stage of the sales funnel. Tracking leads by lifecycle stage helps identify the bottlenecks everyone hates and get those conversion rates up.
Leads by Lifecycle Stage = Total number of leads x % of leads in each lifecycle stage
This metric ultimately helps highlight areas for improvement. For example, if there are a high number of leads in the lead generation stage but a low number in the opportunity stage, your company needs to focus on improving its lead qualification process.
14. Customer engagement score
Customer engagement score measures the level of engagement and interaction customers have with a company's product or service. It's a quantitative measure that assesses how often and how deeply customers engage—because customers who actually use your product are less likely to churn.
Since the customer interactions each business may choose to measure may vary, there's no one formula for finding this metric. Interactions like user sessions or webinar attendance can give SaaS companies valuable insights into customer needs and preferences and use them to encourage further engagement like signing up for trials or demos.
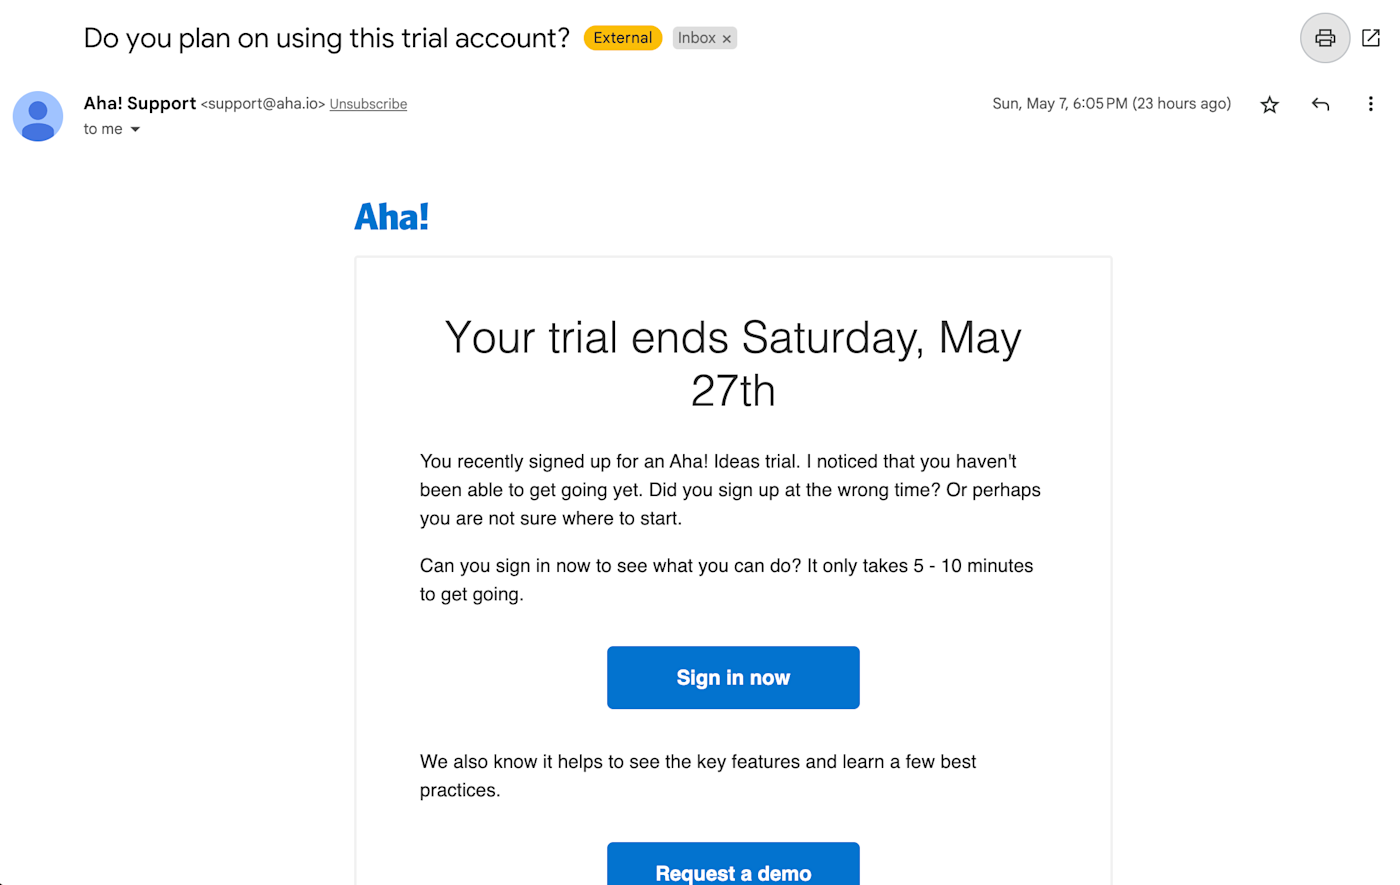
For example, Aha! uses engagement data to send emails reminding people to use the trial they signed up for (check out the screenshot below). Strategies like this can help boost your customer engagement score in the long run.
15. Average first response time
This metric is the average time it takes for a support team member to respond to a customer's initial inquiry or ticket submission.
Average First Response Time = Total time to first response / Total number of inquiries
Tracking average first response time can help SaaS companies identify inefficiencies in their support process, like understaffing or poor ticket routing. Reducing this time can help ensure you have fewer annoyed customers waiting on hold to troubleshoot a glitch.
16. Average resolution time
Average resolution time tracks the efficiency of a company's customer support team in resolving customer inquiries. It refers to the average amount of time it takes for a support agent to resolve a customer's issue, from the initial help request to the final resolution.
Average Resolution Time = Total time taken to resolve all issues / Number of issues resolved
Similar to average first response time, this metric can help highlight where your customer support team can improve. After all, nobody likes being transferred 10 times before they get any real help. Improve this metric, and you can increase customer satisfaction and loyalty, reduce churn, and improve your company's reputation.
17. Customer health score
Customer health score refers to the overall health and satisfaction of your customers. It's usually based on a combination of quantitative and qualitative factors, like usage frequency, feature adoption, customer feedback, and support interactions.
The formula for calculating customer health score varies depending on the specific factors used, but it typically involves assigning weights or scores to each factor and aggregating them into a single score or rating.
In the competitive SaaS space, it's crucial to stand out with top-notch customer service. The customer health score is an important metric for identifying customers who may be at risk of churning or for finding opportunities to improve customer satisfaction and loyalty. For example, if a customer has a low health score due to infrequent usage and limited feature adoption, you could provide additional support to help them get more value from your product.
Tips for measuring key SaaS metrics
Regardless of the metrics that you use to track the performance of a SaaS company, the following data-related best practices should remain top of mind.
You can't (and shouldn't) measure everything: What you measure should depend on your North Star goals, or the most mission-critical outcomes your business hopes to achieve.
You need to understand the "why" behind the data: Measuring the right SaaS metrics isn't enough. You also need to ask questions and get curious about the logic behind the numbers, so you can uncover root causes and drive action.
Remember that a solid SaaS foundation requires a solid data foundation: The most successful businesses take a data-driven approach to decision-making. A "crawl-walk-sprint" process for measuring SaaS metrics can help avoid data-related mistakes.
Know the three metrics buckets—finance, marketing, and sales: It's important to understand which arm of your business is involved in each of the above metrics. Anything related to leads, upsells, and customer acquisition falls under the sales umbrella. Cost, revenue, and growth calculations are finance-oriented. KPIs related to website traffic and customer engagement are marketing metrics.
You (probably) won't get everything right on the first try, but that's the great thing about data—it's all about testing, iterating, and learning what works and what doesn't. Experiment more with data measurements with these sales performance metrics.
Automate with Zapier
Whatever metrics you have top of mind, Zapier can help you streamline the key functions of your business with automation and AI, freeing up time to close more deals and boost conversions. Learn more about how to automate your workflows with Zapier, or get started with one of these pre-built templates.
Create or update ActiveCampaign contacts for new form submissions in HubSpot
Write Brevo emails with ChatGPT based on WordPress posts
Update contacts in ActiveCampaign from new WooCommerce orders
Zapier is the leader in workflow automation—integrating with 6,000+ apps from partners like Google, Salesforce, and Microsoft. Use interfaces, data tables, and logic to build secure, automated systems for your business-critical workflows across your organization's technology stack. Learn more.
Related reading:
This article was originally published by Matt Hammel of AirOps in November 2022. The most recent update, with contributions from Dylan Reber, was in June 2024.
