Spreadsheets bieten leistungsstarke Analysefunktionen, aber manchmal fehlt einfach der letzte Einblick, um wirklich alles zu verstehen. Wenn es um riesige Datenmengen geht, ist es echt schwierig, die Infos in einer einfachen Spreadsheet zusammenzufassen oder Schlussfolgerungen zu ziehen.
That's where pivot tables come in. Most Excel power users use pivot tables as their bread and butter. But you can also use pivot tables in Google Sheets.
Here, I'll walk you through how to create and use pivot tables in Google Sheets.
Inhalt:
Du überlegst, ob du Microsoft Excel oder Google Sheets nehmen sollst? Schau dir unseren Anwendung-Vergleich an, um herauszufinden, welche Anwendung für dich die richtige ist: Google Sheets versus Excel.
Was ist eine Pivot-Tabelle in Google Tabellen?
A pivot table in Google Sheets is a built-in spreadsheet tool that lets you reorganize, summarize, and analyze large datasets based on whatever dimensions you choose.
Think of it this way. Normal spreadsheets typically have "flat data" represented by two axes: horizontal (columns) and vertical (rows). For example, a sales team might track their sales in individual rows, with each column offering different information about that sale. A pivot table shifts (or pivots) those axes to introduce a third dimension. So instead of looking at individual sales, you can see aggregated data like how many units each sales rep sold per product.
While you could pull many of these insights using formulas, the pivot table allows you to distill it in a fraction of the time and with less chance for human error.
How to create a pivot table in Google Sheets using Gemini
The mechanics of creating a pivot table in Google Sheets are pretty straightforward. Knowing which elements to plug in where—so your pivot table actually surfaces the information you care about—is a different story.
If you want to save yourself the headache, just tell Gemini what you want to know, and it'll build the pivot table for you.
Here's what Gemini created when I asked it to create a pivot table and tell me how much we billed in 2025 for each client across different project types. (It's one sentence versus the multiple steps I'm about to walk you through for the same results.) Gemini even automatically generated a summary of how the data was used to build the pivot table.

How to create a pivot table in Google Sheets manually
If you're more of a DIY-er, respect—I admire the commitment and wish I had it. Here's how to create a Google Sheets pivot table step by step.
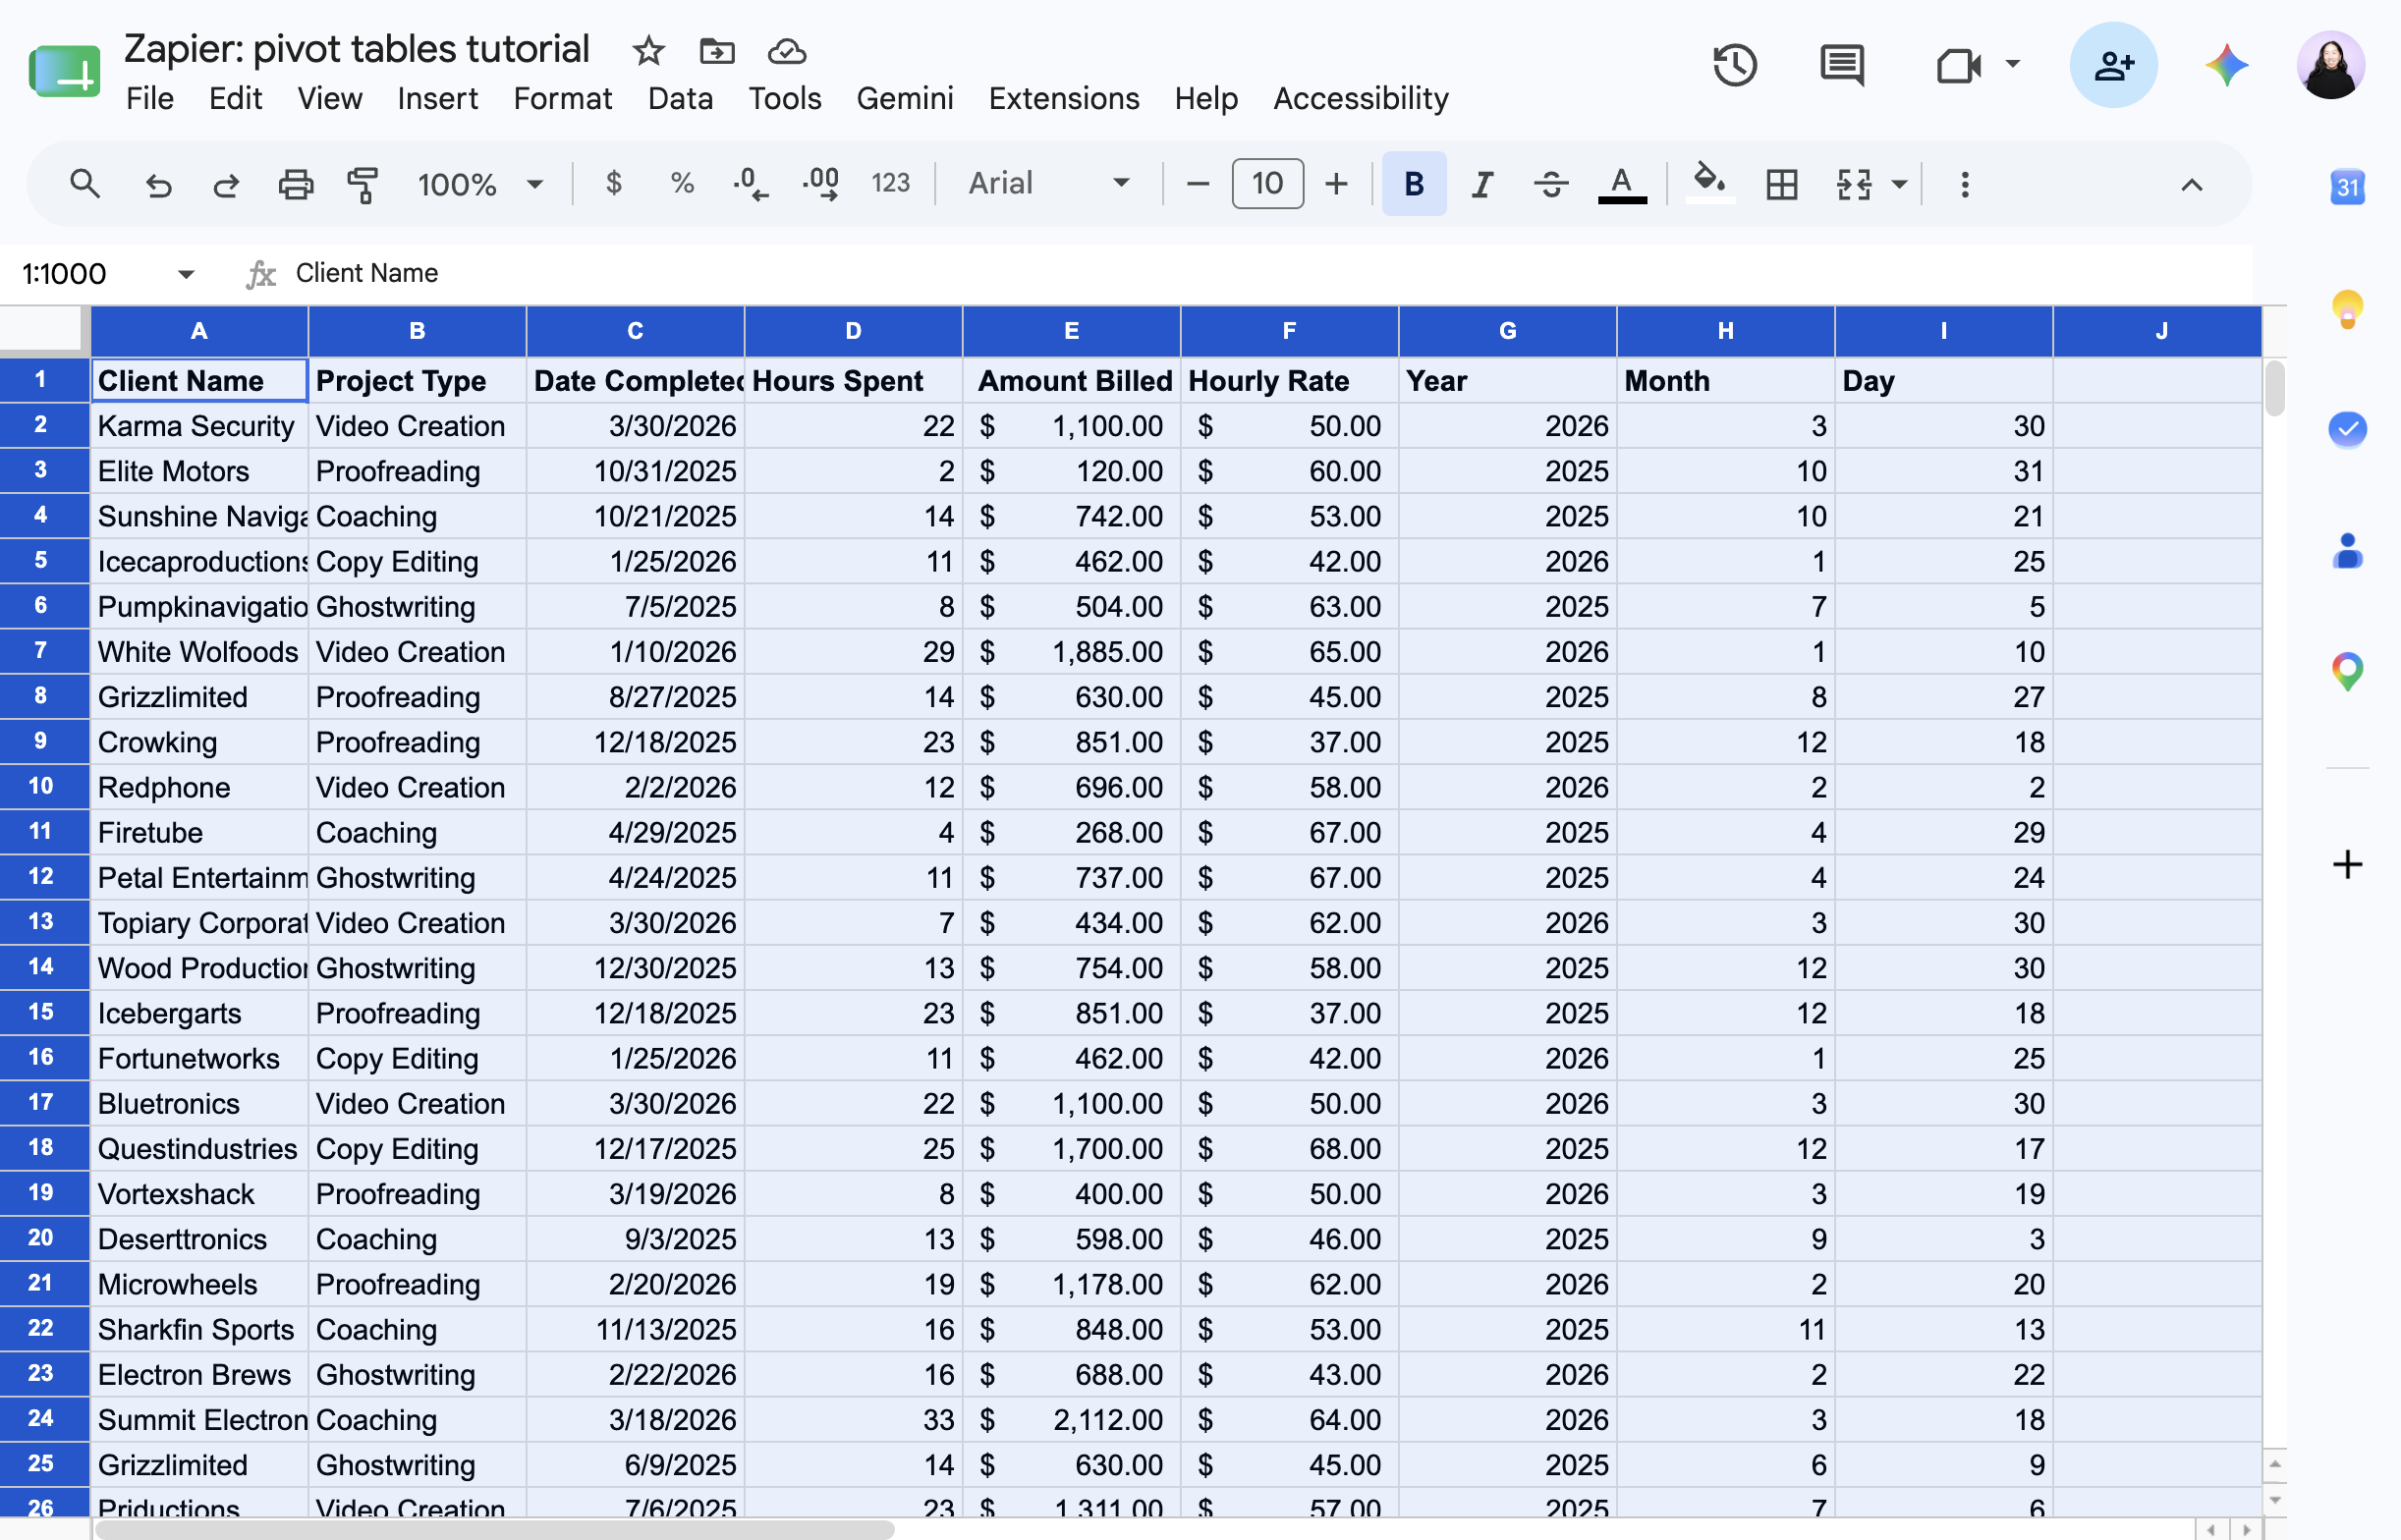
As a reminder, this is the question we're asking: How much did we bill in 2025 for each client across different project types? To follow along, grab our demo spreadsheet.
Select the dataset, including the column headers, that you want to summarize or analyze. If your data set contains columns without headers, you'll need to name these columns in order to create a pivot table.
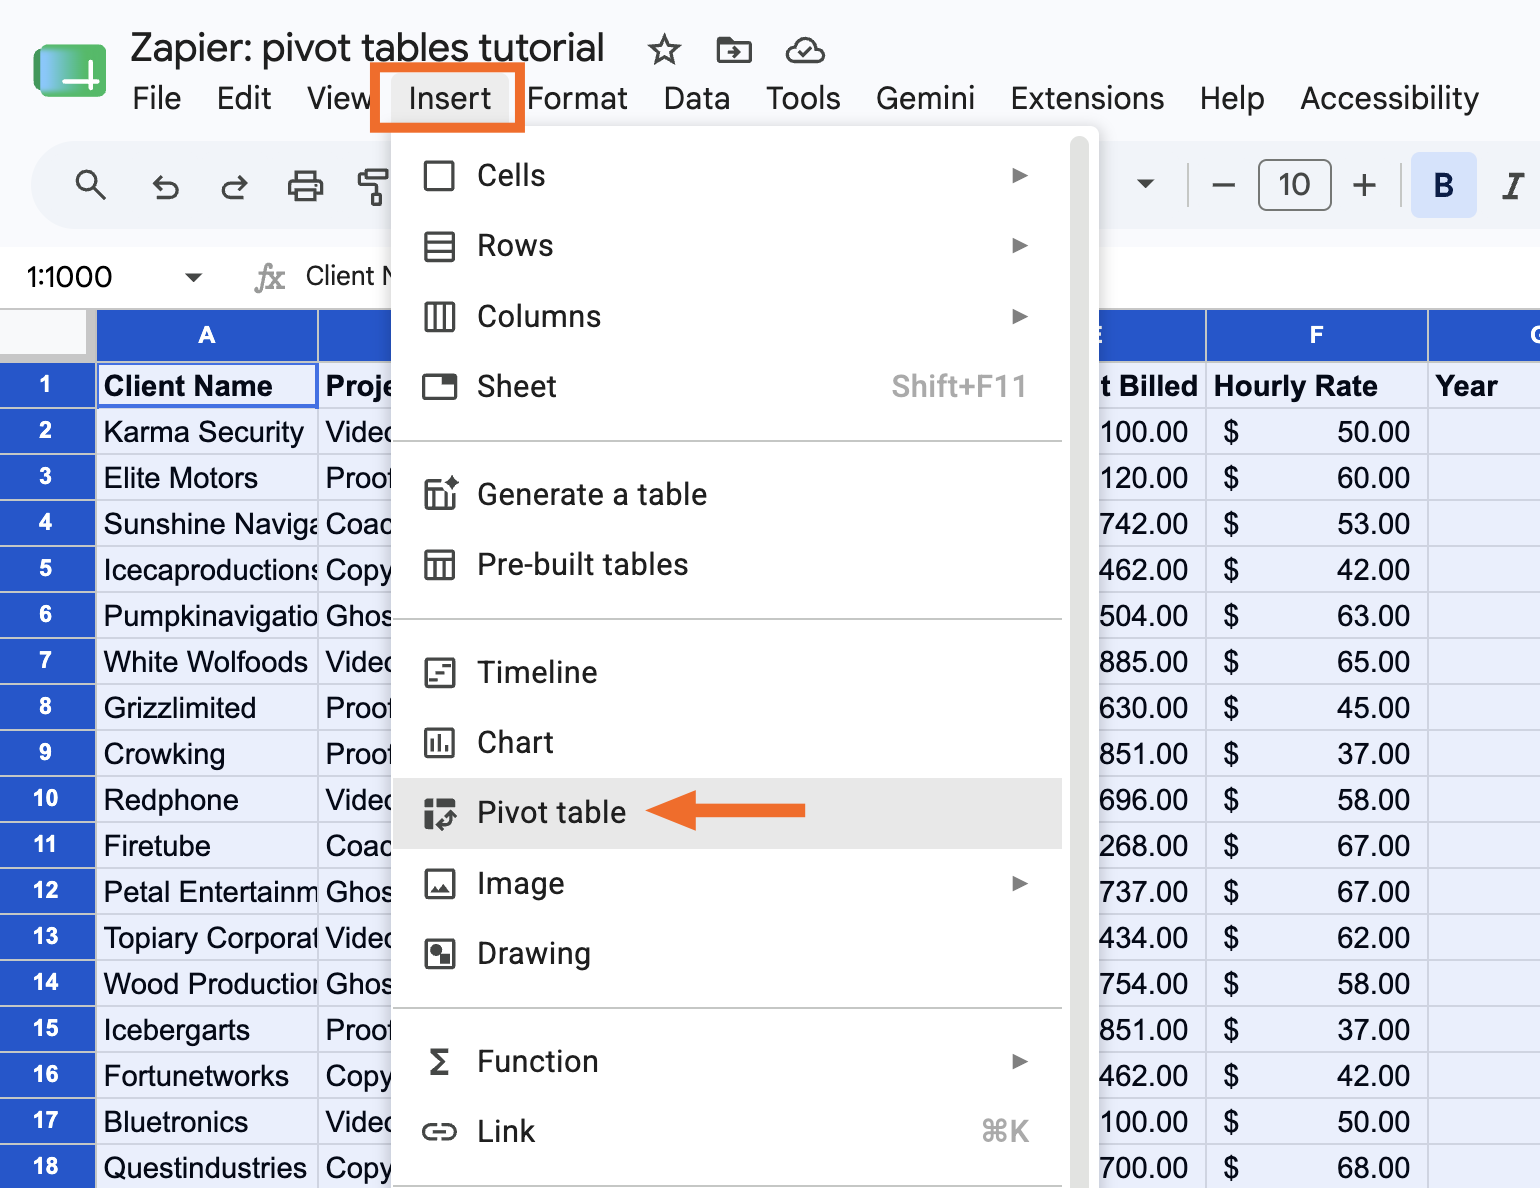
Klick auf „Einfügen“ und wähl „Pivot-Tabelle“ aus.
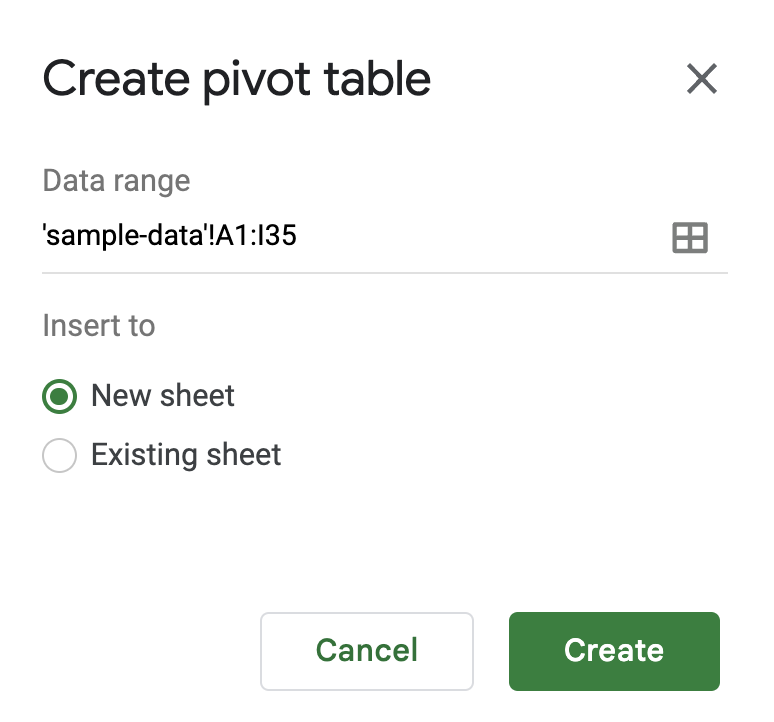
In the Create pivot table panel that appears, choose if you want to insert your pivot table into a new sheet or an existing sheet. Then click Create.
In the Pivot table editor panel that appears, you'll see a few elements you can add to configure your pivot table.
Rows: Choose which field you want to list down the left side of your pivot table. Google Sheets will pull every unique value from that field and stack them as rows. In our example, that's Client Name, so each client gets its own row.
Columns: Choose which field you want to spread across the top of your table. Each unique value will become its own column header. In our example, that's Project Type, so each project type gets its own column.
Values: Choose what number you want to see where each row and column meet. You can show these values in different ways (sum, average, count) depending on the value type. In our example, we want the SUM of Amount Billed, so each cell shows the total billed for that client and project type.
Filters: Choose a field to limit which data gets included in your table at all. In our example, we filter by Year and select only 2025.


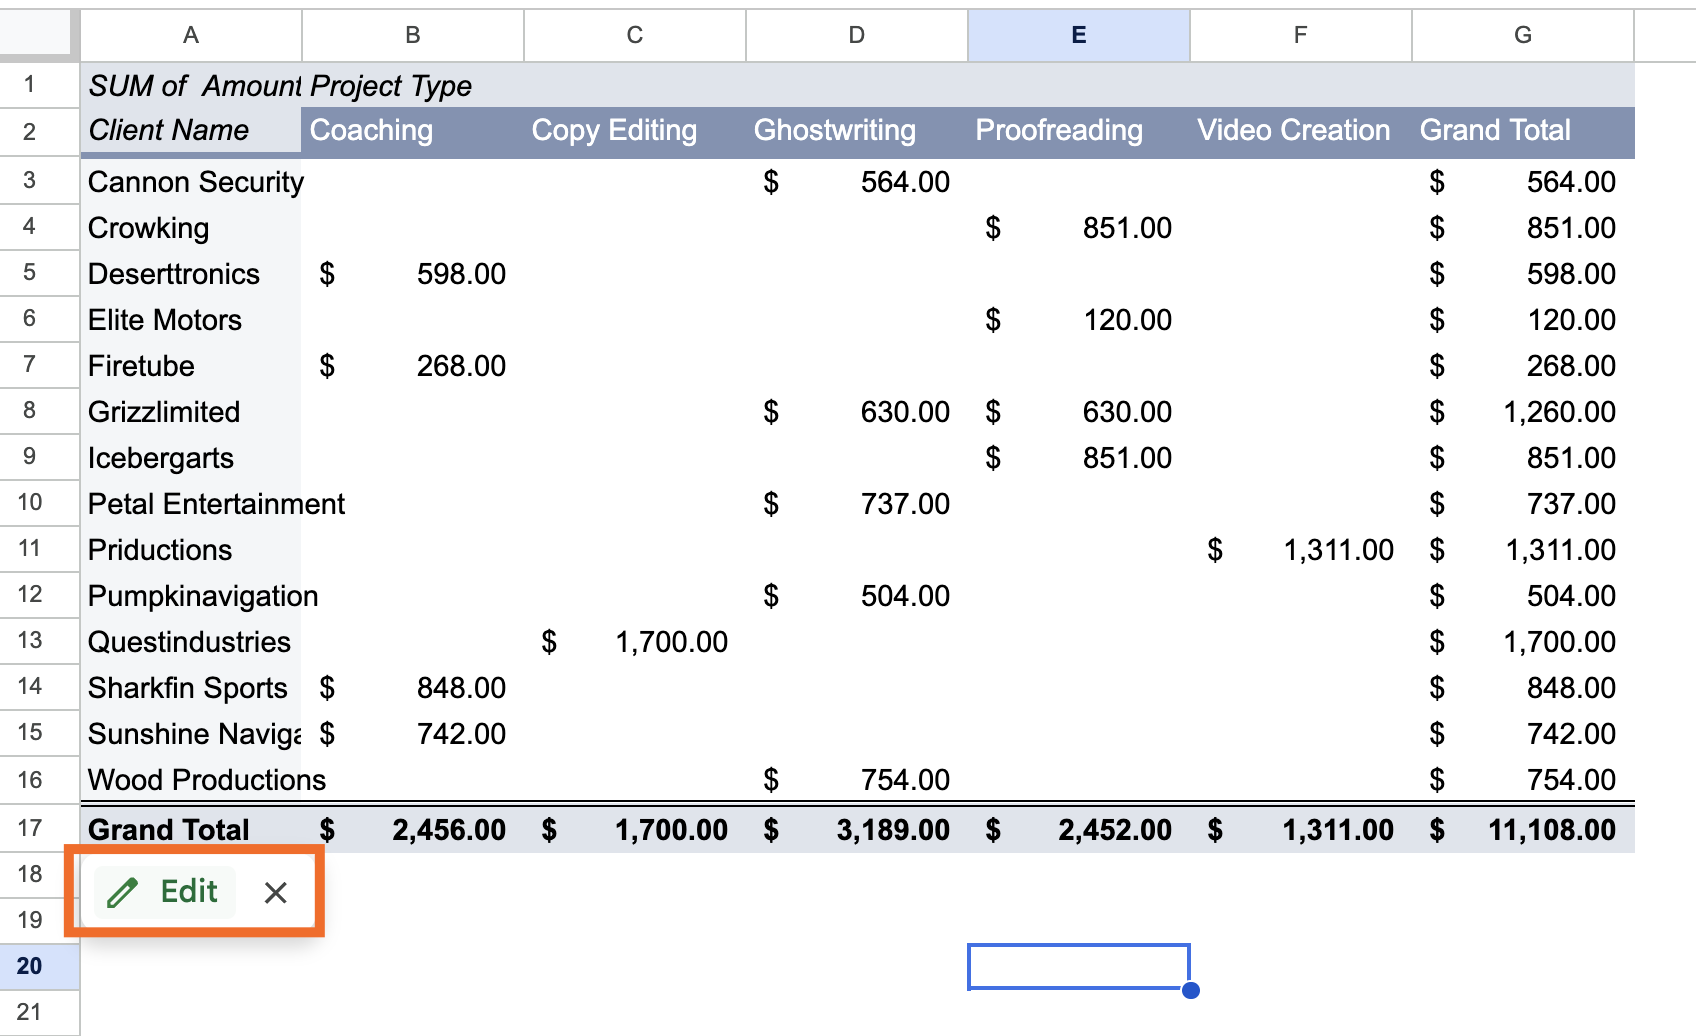
That's it! Now you have a pivot table that answers the question, "How much did we bill in 2025 for each client across different project types?"
So aktualisierst du eine Pivot-Tabelle in Google Tabellen
Let's say you've edited your original source data. These changes should automatically be reflected in your pivot table. If you don't see the changes reflected, refresh your web page. It may take a minute depending on the volume of data.
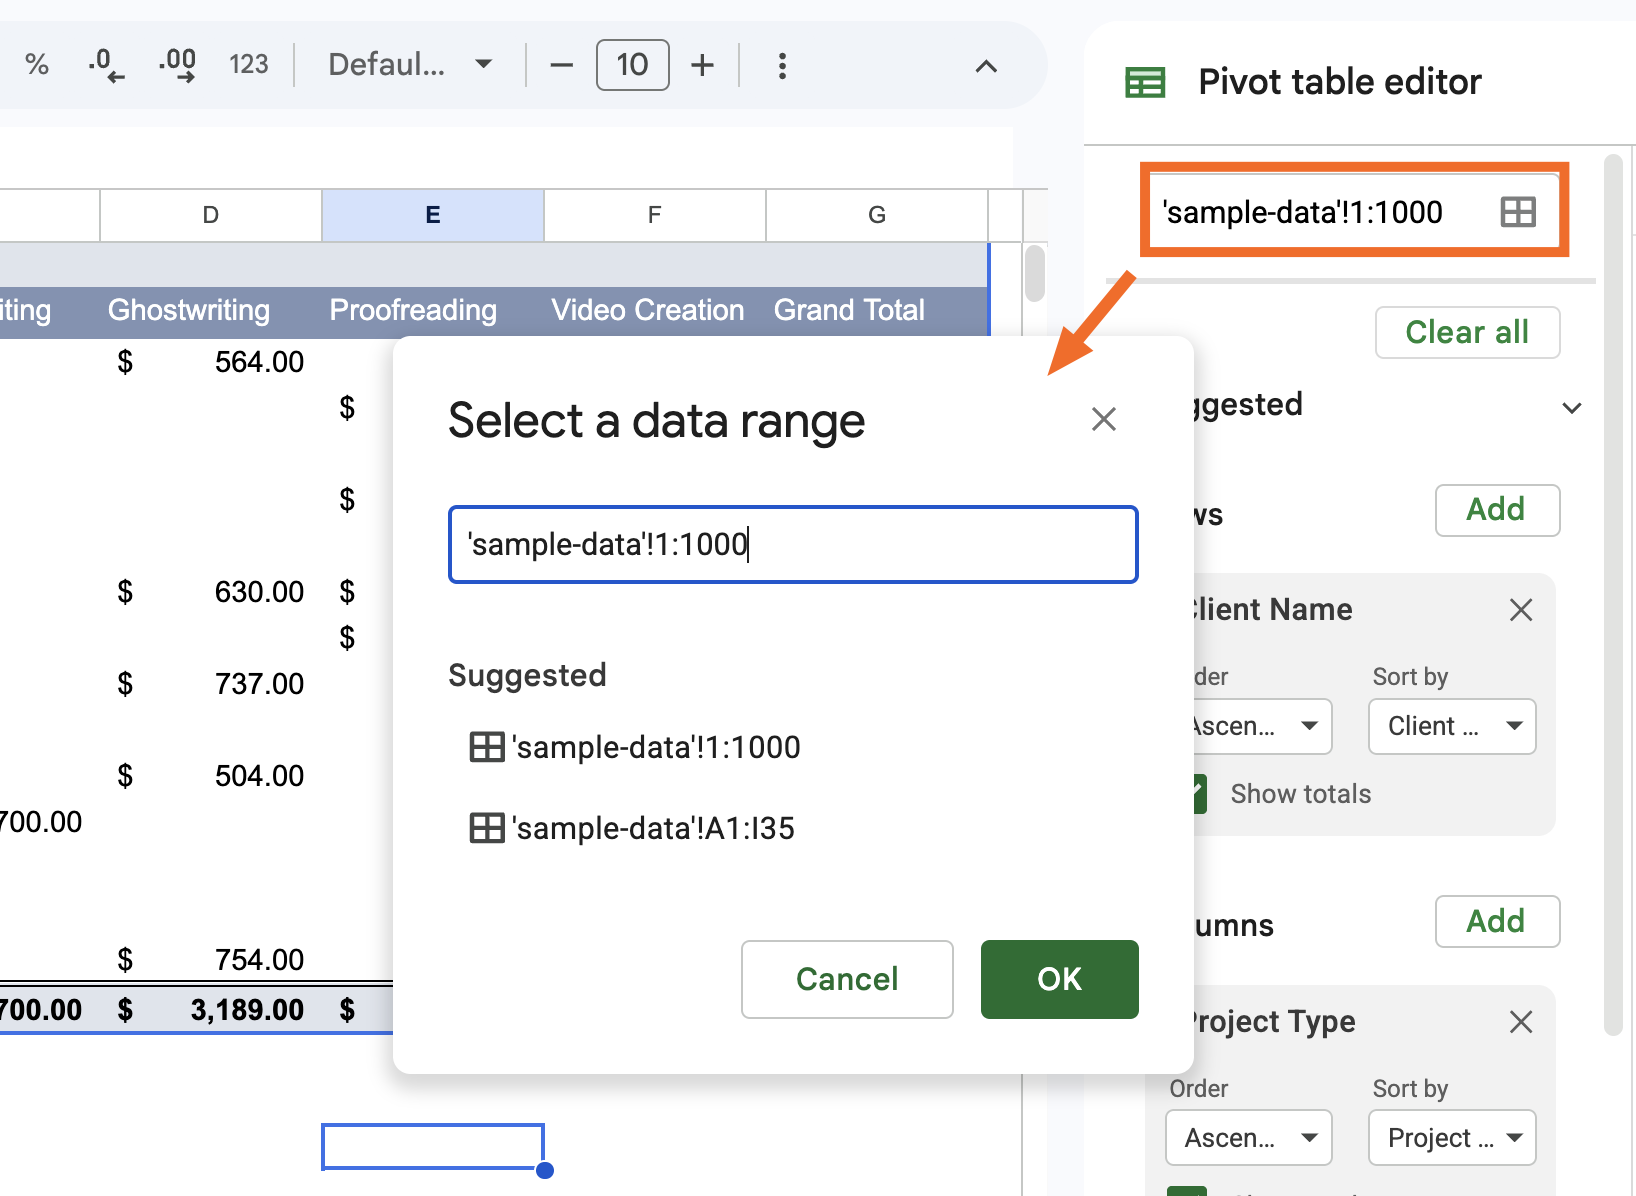
If you've added new rows or columns of data to your original source data, however, a simple refresh won't do the trick. Instead, you need to update your pivot table's data range to include the new rows or columns.
Geh mit der Maus über die Pivot-Tabelle und klick auf „Bearbeiten“.
Click the Select data range icon at the top of the panel, and enter your new data range.


So erstellst und nutzt du Pivot-Tabellen in Google Tabellen: Häufig gestellte Fragen
Hast du noch Fragen zur Verwendung von Pivot-Tabellen in Google Tabellen? Schau dir die Antworten auf diese häufig gestellten Fragen an, damit du das Beste aus deinen Spreadsheets herausholen kannst.
Werden Pivot-Tabellen in Google Tabellen automatisch aktualisiert?
Yes, with one caveat. If you edit existing cells within your data range, changes will automatically show up in your pivot table. If you add new rows or columns outside of it, you'll need to manually update the data range first.
Kann eine Pivot-Tabelle aus mehreren Arbeitsblättern abrufen?
Pivot-Tabellen in Google Tabellen können nur auf ein einziges Arbeitsblatt verweisen. Wenn du möchtest, dass deine Pivot-Tabelle auf Daten aus mehreren Arbeitsblättern verweist, musst du diese Daten erst in einem Arbeitsblatt zusammenfassen. Anschließend können Sie wie gewohnt eine Pivot-Tabelle erstellen .
Können Sie zwei Pivot-Tabellen in einem Blatt haben?
Du kannst mehrere Pivot-Tabellen in ein Google Tabellen-Arbeitsblatt einfügen.
Erstellen Sie wie gewohnt eine Pivot-Tabelle.
Wählen Sie im angezeigten Bereich Pivot-Tabelle erstellen die Option Vorhandenes Blatt aus und geben Sie das Arbeitsblatt und die Zelle ein, in die Sie Ihre neue Pivot-Tabelle hinzufügen möchten.
Klick auf „Erstellen“.
Können Sie zwei Pivot-Tabellen zusammenführen?
In Google Tabellen gibt's keine Möglichkeit, zwei Pivot-Tabellen zusammenzufügen, aber es gibt einen Trick. Kombiniere die Originalquelldaten für beide Pivot-Tabellen in einem Arbeitsblatt und erstelle dann eine neue Pivot-Tabelle.
Google Tabellen mit Zapier automatisieren
Pivot tables are only as good as the data behind them. Zapier connects Google Sheets to 9,000+ apps, so you can automatically pull in data from wherever you need it, including form submissions, CRM updates, and ad leads.
And if you're already working in Claude, ChatGPT, or another AI tool, Zapier MCP lets you go further: you can ask your AI assistant to pull data from your connected apps, update your spreadsheet, or practically anything else you can think of, all without leaving your chat window. You could even ask it to figure out which client you billed the most in 2025, pull up their contract in Docusign, and draft a renewal email. Discover more ways to automate Google Sheets.
Verwandte Lektüre:
This article was originally published in September 2018 by John Thomas. The most recent update was in June 2026.